the United States in search of the
American Dream which is a complicated
that means different things to different
people but I’m going to distill it to a
simple statistic that we can measure
systematically in the data which are the
odds that a child born to parents in the
bottom fifth of the income distribution
reaches the top fifth of the income
distribution so think of the classic
Horatio Alger version of the American
dream
so how common is that in the United
States versus other developed countries
around the world in the u.s. seven and a
half percent of children who are born to
parents in the bottom fifth make the
leap all the way to the top fifth that
compares with nine percent in the United
Kingdom eleven point seven percent in
Denmark and thirteen and a half percent
in Canada now initially when people look
at these statistics they sometimes react
by saying oh even in Canada it looks
like your odds of success aren’t all
that high right only thirteen and a half
percent of kids make it to the top
starting from the bottom but you have to
remember of course that no matter what
you do you can’t have more than twenty
percent of people in the top twenty
percent right and so the maximum value
that the statistic can take is plausibly
twenty percent if you had a society
where your parents played no role at all
in determining your outcomes you’d
expect 1/5 of kids to rise from the
bottom 20% to the top 20% so relative to
that benchmark max of a twenty percent
rate these are actually quite large
differences in rates of upward mobility
across countries one way I think about
it is that your chances of achieving the
American Dream are almost two times
higher if you’re growing up in Canada
than in the United States now these
differences across countries have
attracted a lot of attention and have
been the focus of much policy discussion
a lot of worry that the u.s. is no
longer a land of opportunity contrary to
its traditional billing but what I’m
going to focus on in this talk today is
that upward mobility actually varies
even more within the United States and I
think we can learn a lot from that in
recent work with my colleagues we
calculate upward mobility for every
metro and rural
the US and we do that using anonymous
earnings records drawn from tax and
Social Security databases on 10 million
children born between 1980 and 1982 so
basically all kids born in America
between 1980 and 1982 and the analysis
that I’m going to show you is an example
of a very important broader trend in
economics and social science which is
the use of big data to solve important
social problems so much as you all hear
about big data being used in the private
sector and companies like Google and
Amazon to provide better products
likewise our vision is that we can use
these data to solve some of the most
important social challenges of our time
so using this data from drawing from tax
records we construct this map here which
shows you the geography of upward
mobility within the United States what
we do is divide the u.s. into seven
hundred and forty different metro and
rural areas and in each of those areas
we take the set of kids who grow up in
that area and look at the same statistic
that I started out with what fraction of
the children who start out in a
low-income family in the bottom 20% of
the income distribution make the leap to
the top 20% of the income distribution
the map is colored so that lighter
colored areas represent areas with
higher levels of upward mobility greater
rates of achieving the American dream
you can see when you look at this map
that there’s an incredible spectrum in
rates of upward mobility within America
in the center of the country in places
like Iowa for example rates of upward
mobility exceeds 16 percent higher than
the numbers we saw for Denmark and for
Canada at the other end of the spectrum
if you look at places like Atlanta or
Charlotte you see numbers below four and
a half percent lower than any country
for which we currently have data so even
within America there are some places
that are truly lands of opportunity and
there are other places that are better
described as lands of persistent poverty
now in this big map you naturally your
eyes gravitate towards the broad
regional variation the Midwest looks
good the southeast looks much worse etc
but if you zoom into narrower
geographies you see that there’s quite a
bit of variation even across relatively
nearby area so here were zoom
into the bay area and looking at the
data across counties within the bay area
and you could see that if you’re growing
up in the 1980s in San Francisco or in
San Mateo or Santa Clara in a low-income
family you had really good chances of
succeeding you’d be something like 18
percent probability of making it to the
top 20% which relative to that 20%
maximum I was talking about it’s really
a remarkable rate of upward mobility in
contrast if you go across the Bay Bridge
to Oakland you see that the probability
of rising up Falls by nearly a factor of
two so even within relatively small
geographies there are substantial
differences in children’s chances of
succeeding so naturally the question of
interest to us as academics and to
policymakers is to ask why upward
mobility vary so much across areas and
what ultimately we might be able to do
from a policy perspective to increase
rates of upward mobility throughout the
US so the first step in our analysis of
that question as to establish that much
of this difference in upward mobility
across areas is caused by differences in
childhood environment we demonstrate
that by studying five million families
that move between areas in the United
States rather than going to the details
of the analysis let me give you a simple
example to show you how this works so
let’s take a set of families that start
out in Oakland and to pick a number
suppose if you’re growing up in a
low-income family in Oakland when you’re
30 years old you have an average
earnings of $30,000 if you grow up in
Oakland from birth now let’s consider a
set of families that move from Oakland
to San Francisco where as we saw kids
and low-income families appear to have
better outcomes so again to pick a round
number suppose if you grow up from birth
in San Francisco you earned $40,000 on
average when you’re 30 years old so now
consider a family that moves from
Oakland to San Francisco with a child
depending upon the age of their child so
let’s start with families who move when
their child is exactly nine years old
which happens to be the earliest age we
can look at and currently available data
so if you move at age nine what we’re
going to do is then track that child
forward twenty-one years and the
we have to look at how much that child
is earning at age 30 and what we see is
that this child on average ends up about
halfway between the kids who grew up in
Oakland from birth and the kids who grow
up in San Francisco from birth that is
that child is earning about $35,000 on
average when we look at their incomes at
age 30 now let’s repeat that analysis
for kids who moved when they were 10 11
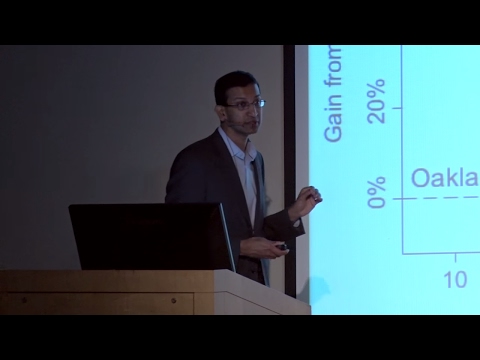
12 13 and so on and what you see is a
very clear declining pattern the later
you make that move from Oakland to San
Francisco the less of the game your
child gets if you move once you’re in
your early 20s you get essentially no
gain at all and if you move after that
point there’s no impact whatsoever so
what you see in this chart is that where
you grow up really matters place matters
if you take a given child and move that
child from San Francisco to Oakland you
see really meaningful changes in that
child’s long-term outcomes and second
you see that it’s really child and
environment that appears to be critical
right moving when you’re an adult
doesn’t do a whole lot for you it’s
moving when you’re a kid and
particularly moving in younger ages that
has a lot of impact now naturally the
next question is to ask okay so we think
childhood environment really matters in
in determining kids long-term success so
what is it about places like San
Francisco or the Bay Area in general
that generate really good outcomes
relative to places like Atlanta where we
see much lower levels of upward mobility
we’ve looked at a variety of factors
that correlate with these differences
and rates of upward mobility across
areas that I’ve been showing you I’m
gonna show here in the interest of time
the five strongest correlations that
we’ve identified the first is
segregation we find that places that are
more residentially segregated by race or
by income tend to have much lower levels
of upward mobility now this pattern is
so clear that you can just see it
visually so let me give you a couple of
examples so this map here depicts racial
segregation in Atlanta the way it’s
constructed is that each person in
Atlanta is represented by a dot and the
dots are colored such that whites are
blue blacks are green
Asians are red and Hispanics or orange
you can see immediately that Atlanta is
an incredibly segregated City the blue
dots are in a completely different part
of the city relative to the green dots
the blacks and whites live in totally
different parts of the city now cities
that look like Atlanta in terms of
racial or income segregation tend to
have the lowest levels of upward
mobility in our data compare that with
Sacramento which has the same minority
fares Atlanta that’s the same fraction
of blacks and Hispanics as Atlanta you
can see immediately that Sacramento is a
much more integrated City the colors
these dots are much more interspersed
right and corresponding to that
Sacramento and cities that look like it
have much higher rates of upward
mobility
so that’s the first robust pattern we
find residential segregation perhaps
because of a lack of exposure to role
models or friends or people who are
going to help you get better jobs being
in a more segregated area whatever the
mechanism is strongly negatively
associated with upward mobility we look
at a number of other factors now just
summarize these more quickly we find
that places with more income inequality
a smaller middle class tend to have
lower levels of upward mobility we find
that places with more stable family
structures that is more two-parent
families tend to have higher levels of
upward mobility and related to that
places with more social capital so this
is the idea of whether someone else will
help you out even if you’re not doing
well places with more religious
participation more civic engagement
those sorts of places tend to have
higher levels of upward mobility and
then finally as you might expect
intuitively places with better public
schools tend to have much higher levels
of upward mobility as well so this gives
you a sense of what we think is driving
some of these sharp differences in rates
of achieving the American Dream across
areas what I want to do in the final
couple of minutes is present a different
perspective on these issues of upward
mobility so the traditional argument for
greater social mobility think the reason
that a lot of people are interested in
these issues at the moment in the United
States is based on principles of justice
the idea that everyone should have a
shot at the
American dream no matter their family
background but what I want to show you
here is that improving opportunities for
upward mobility even if you’re not
concerned about justice and just want to
maximize economic growth and GDP it
might still be of interest to think
about how to increase opportunities for
upward mobility to illustrate that I’m
gonna focus on one specific pathway to
upward mobility which is innovation a
pathway that’s particularly relevant I
think here in Silicon Valley in this
study that I’m going to describe we
linked data on the universe of patent
holders in the United States to the tax
records that I was describing earlier so
that we can study the lives of inventors
so we can ask wherein mentors in America
come from and how ultimately we might be
able to get more of them I’m gonna start
with this chart here which shows you the
probability of becoming an inventor
versus parent income the way this is
constructed is on the horizontal x-axis
as parent income percentile there are
hundred dots here corresponding to each
percentile the parent income
distribution and on the y-axis is the
number of kids who go on to become
inventors that is have a patent by their
mid-30s you can see that there’s an
incredibly strong relationship between
your parents income and your probability
of going on to become an inventor if you
happen to be born to parents in the top
1% of the income distribution you’re 10
times as likely to have a patent as if
you happen to be born to parents at the
median of the income distribution in the
US so why is that one possibility is
that it’s about the factors that I’ve
been discussing here differences in
childhood environment schools resources
while you’re growing up maybe high
income kids have much greater access to
all of those things relative to low
income kids and that’s what’s driving
this innovation gap a different
explanation is that this is about
differences in ability presumably the
parents who got to the top 1% of the
income distribution were quite talented
and maybe that’s why their own kids are
more likely to become inventors than be
successful themselves discriminate
between those two explanations we bring
in data on test scores of kids early in
childhood as a measure of ability
relatively early on and construct this
chart here
which shows you your the fraction of
kids who go on to become inventors
versus third grade math test scores so
each dot here represents five percent of
the test score distribution and what you
can see is if you’re below something
like the 85th percentile of your third
grade math class
odds are you’re probably not going to go
on to become an inventor as measured by
having a patent but if you’re in the
upper tail of your third grade math
class particularly at the very top your
probability of becoming an inventor
really shoots up now what’s interesting
most relevant for the purposes of this
talk is if we now cut this data looking
at kids from low-income and high-income
families separately so again look at the
fraction of kids who go on to become
inventors
versus their third grade math test
scores but now look at kids from
relatively high income families in the
red above the median and low-income
families in the blue you see a very
striking pattern which is that high
ability kids these kids were at the top
of their third grade math class are much
more likely to become in mentors if
they’re from high-income families if
you’re from a low-income family and
you’re at the top of your third grade
math class your probability of becoming
an inventor doesn’t look all that much
higher than the rest of the kids in the
class so to put it differently these
data suggests that in America in order
to become an inventor you need two
things you need to be smart as measured
by your test scores for instance early
in childhood and you need to be from a
rich family and that I think gives you a
very different perspective on issues of
equality of opportunity it suggests that
if we can bring more of these kids from
low-income families who are doing really
well early on in school through the
innovation pipeline that would benefit
not only them in terms of greater
opportunities for upward mobility but it
would also benefit the rest of us by
having more people who might discover
the next blockbuster drug or develop the
next iPhone in order to give you a sense
to link back to the geography issues
that I started out but I’m going to
close with with this map here which
shows you the origins of inventors in
America this gives you a sense of what’s
driving that innovation gap so this map
shows the fraction of kids who go on to
become inventor
by where they grew up again these 740
Metro and rural areas and the map is
colored so that darker red colors here
represent areas that produce more
inventors what you can see is places
like the Bay Area or the Northeast or
Austin Texas if you focus here tend to
be much more likely to produce kids who
go on to become inventors than other
parts of the country and that echo is a
broader pattern which is that exposure
to innovation while you’re growing up
really influences your own likelihood of
becoming an inventor and this turns out
to be a pattern that holds in a very
specific way so the type of innovation
you end up doing in adulthood is greatly
determined by the area in which you grow
up let me give you an example so take
two kids who are let’s say are currently
in Boston and say one grew up in Silicon
Valley like many of you and one grew up
in Minneapolis Silicon Valley has a lot
of computer innovation maybe Minneapolis
happens to have a lot of medical device
manufacturers it turns out that if you
look at these two kids who are currently
in Boston the kid who grew up in
Minneapolis is more likely to have a
patent in medical devices and the kid
who grew up in Silicon Valley is more
likely to have a patent in computers so
in a very specific way children seem to
be greatly influenced by the exact
environment which they grow up and I
think much of the innovation gap is
explained by the fact that kids from
lower income backgrounds don’t have the
internship opportunities the network’s
the connections that lead them to to
become in mentors down the road and so I
think that is potentially an empowering
message for many of us here in Silicon
Valley because it shows that we can
ourselves have important effects on in
the innovation gap and on equality of
opportunity by giving kids from
disadvantaged backgrounds better
opportunities and I think we would all
benefit greatly from doing that so I’ll stop there thanks very much