
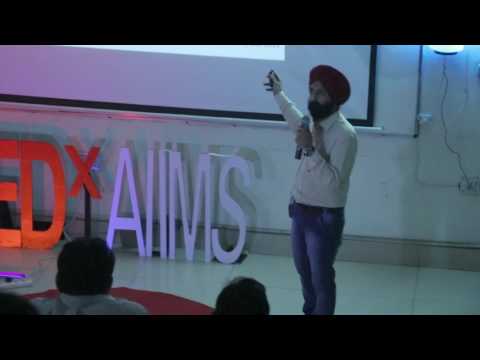
some doctors are amazing computer
scientists I would say with the kind of
tinkering that you can do with human
physiology which is the most complicated
machine we are really amazing hackers do
you know that it took about eighty four
thousand processors put together into
the Japanese supercomputer K the steam
so to simulate just one second of human
brain activity and I’m not talking of
the brains that are sitting here I’m
talking of regular vanilla brains so so
if you are really worried about robots
taking over the world or even taking
over this event the humans are in safe
space but seriously ten years back when
I was finishing medical school I didn’t
feel like I was a hacker of physiology I
didn’t feel like that I could hack
precisely disease back to health and I
was at a loss so I took to science and I
was happy that I do it I did it and it
was the era of big day right the big
data was just beginning genomics
revolution had begun with big data
permeating into medicine but there was a
problem
very few people here would know that I
I’m not sure if you could hear that but
that was the problem of the Big Data
revolution we thought that our
physiologies and our health is a meetly
laid out organized system and if we had
the data we could actually create the
music but now we know that is not the
case so traditional data which look like
the one of left was neatly organized
medical research was neatly organized
whereas now we know for sure that
neither our physiologies nor the big
data is neatly organized it’s like it’s
messy actually we are a mess it’s like
the Einsteins messy desk
nobody knows where are the connections
how to make those connections and that’s
why I would say that doctors biologists
engineers bio physicists and biochemists
really need to take up the science of
data because after all we have the
connections made up in the right side of
our brain and from there it’s just one
leap onto the left side of the brain
which is quantitative thinking so what
I’m gonna do today is break up that
quantitative thinking it into three
smaller steps that we can understand and
take these are phenotype deeply approach
systemically and enable decisions so if
I were to ask you that the beating of
our hearts resembles which of the images
on the top the left of the right you
might be surprised to know that a heart
rate intubate intervals do not resemble
the periodic pattern on the left they
actually resemble the complex multi-tier
of fractal patterns that are found all
over the nature on the right like the
broccoli here so diversity and
complexity are actually a measure of
healthiness of health
I enjoyed doing my PhD and viola was
having fun with looking at these signals
we really found a use for it the
phenotype the signals deeply and we
found that these signals really held
meaning for small airway disease which
is notoriously difficult to detect so we
could design a non-invasive marker of
small early small airway disease without
doing biopsies and this was based on the
mathematics of the how our respiratory
trees behave and we were able to show
that this achieved unprecedented
sensitivity the resolution that you see
on the right versus the standard
techniques that you see on the left so
this is just one example of phenotyping
deeply but I would warn you that
phenotyping deeply sometimes can get
immersive we can get lost in the
patterns because the mathematics is
beautiful so here I come to the second
principle that I use continuously in my
data science which is approach
systemically look at the forest first
whether it makes sense whether the
bigger picture makes sense and this I’m
going to illustrate by our work on
200,000 patients data collected on a
single day all across India by Chess
Research Foundation Pune
we were skeptical because this was
questionnaire based data so I decided to
do the checks by doing the big picture
first by doing network analysis and
that’s what we found
each node here is a symptom or a disease
and you could see that in the bigger
picture diseases have friends they form
communities and they are in key
influencers in this network in this
disease makeup which you call the
symptom this symptom is the symptom of
the pediatric age group of the Indian
population we imagined how would these
networks change across age group how
would they flow we did just that by
using computational techniques and he
found that on the x axis here is the age
groups 0 to 10 and more than 16 you
could see that these networks far
formed loaded streamlines the most
loaded streamline is the respiratory
streamline hair it’s being the most
prevalent but look at circulatory in the
red
it becomes more loaded as we age and it
merges with endocrine which is diabetes
most predominantly that top streamline
thin stream lining on the top is female
genitalia it gets loaded it comes down
it merges with anemia they stay together
in the reproductive age group and then
they separate out any me of menstrual
disorders is so hugely prevalent in
India and this big data was actually
telling us some stories but we didn’t
stop at stories we decided to take it
further to do machine learning and
artificial intelligence models to really
make predictions here is a Bayesian
network analysis which is an artificial
intelligence model upon the same data
but what we did here was we combined
that 2 lakh patient data together with
the data available on LPG penetration
into the country clean cooking fuel and
we found that we did the Bayesian
networks analysis LPG penetration which
is in green the Novo comes out to be
linked with obstructive airway disease
these are separate sources of data
remember there’s no crosstalk between
them before the analysis so what if this
was just an incidental finding the same
techniques that allowed us to track
dynamically the change in networks we
used here to track the stability of
models and that’s what you see on the
top by using bootstraps upon the same
data each seeing a different angle of
the data critical conditions like sepsis
and bad outcomes by using big data and
the patterns that I just kind of showed
you so we will be using phenotyping
deeply approaching systemically and
enabling decisions to create alerts for
so where are we now since it is a full
spectrum project we have started in the
data science right from the scratch we
are building up these resources we are
building up technologies we are build we
have built up 4,000 hours 40,000 hours
of continuously monitored data at the
Department of Pediatrics over the last
five months but are we big yet I would
not say yes my collaborator at Stanford
School of Medicine has access to about
3.5 million hours of in continuous
recording but we are starting right from
the scratch and we are injecting our
domain expertise into the building up of
the systems and also in building up of
the models so we’ll be there soon those
brocolli patterns that I showed earlier
they are actually enabling us to detect
stability of these patients in the ICUs
how stable they are how wondering are
these signatures do they relate to
outcomes for the real results on this
we’ll have to wait a bit just like any
full-spectrum project we have a great
team and an amazing set of mentors and
I’m really proud of the team of doctors
and engineers that is actually backing
us so what is the new pulse of Medicine
is it big data or is it get a science or
is it machine learning I would say that
the new pulse of medicine is you all
those who venture out into the
next-generation medicine and will create
a difference let’s make every bit count
thanks very much [Applause]