
marked by the passing of the American
sport seasons summer is of course
baseball season so when I was young my
dad would take me to a Colorado Rockies
game in downtown Denver and we’d make
our way to our seats and once the game
began he’d hand me a clipboard a
mechanical pencil and a paper scorecard
and I’d help him score the baseball game
baseball scoring is a dying art but it
has its roots in the cricket scorecards
that you lot the British invented a
scorecards double sided with one team on
each side with the innings across the
top and the players in batting order
down the side and using a set of cryptic
abbreviations and notations you notate
each plays that happens in the game
there are some general conventions but
no single set of notations and these are
often adapted by scores in idiosyncratic
ways and then these idiosyncrasies are
passed from one generation to another
like from father to daughter and so I’d
sit by my dad watching and scoring the
game sometimes asking him for help
and we’d slowly fill out the scorecard
together when the game is ended and the
score card is filled my dad and I didn’t
go home and analyze the data we gathered
in order to drive deeper insight about
the players instead my dad put the score
card in his filing cabinet to keep as a
souvenir sometimes he’d even put the
weather for the game on top of the
scorecard and when I was young I’d joke
that in the winter he could keep himself
warm by rereading his collection of
scorecards and imagining himself in the
Sun now while I’ve painted a picture of
Anna Dilek father-daughter scene to be
honest I often found baseball games long
and boring often being much more
interested in visiting the souvenir shop
or buying candy or following boys around
the stadium concourse
but still for some reason the physical
act of scoring a baseball game stuck
with me and this often litter
the left field experience greatly
influenced my creative practice probably
because it was the first time I gathered
and visualized data looking back I
scored a game for the same reason every
other score does to stay in the moment
to be present to be less distracted to
get in the game and to make a souvenir
of the game you can always refer back to
through freezing and preserving it in
between two sides of paper like insects
fossilized in amber these early
experiences with my father convinced me
there’s a power in the process and
experience of data gathering and that
data gathering can offer benefits more
focused on the well-being of the data
collector instead of statistical insight
as I got older these baseball games
became a thing of the past as at 22 I
moved to the UK for an MA in
communication design and on my MA
my early experiences with baseball
scoring manifested themselves in a
project I called riding without words
where I gathered data from on the road
by Jack Kerouac and then explored ways
of visualizing this data to highlight
the hidden prep the hidden patterns and
structure of attacks here my experience
of the baseball scorecard also compelled
me to gather data from the text in the
same engaged manner by hand using the
process to get closer to a book I loved
as a teenager then once I visualize the
data I again felt that satisfaction of
being able to press a large amount of
information an entire novel onto a
single side of paper this was the first
data project I’d ever created and it
really can my interest in this analog
process of looking collecting and
notating and so I began to create design
work where this type of manual notation
was an integral part of the design
process where statistical insight took a
backseat to the experience of engaging
with data where the end design function
both as a souvenir of the process
also aim to communicate messages beyond
the insights locked within the data and
these messages are often more subjective
and driven by emotion this different way
of working with data can be seen in my
piece at the Olympic Park in East London
from last year made using data that
schoolchildren had to collect it from
the park not for statistical insight but
inside to inform the design of a new
data-driven park landscape and another
example can be seen in a collection of a
thousand small drawings that visualize
data from the thousand most frequently
used English words visualise not to draw
statistical insight but instead to
highlight the beautiful variation in the
English language and displayed at the
British Council Pavilion at a Book Fair
in Mexico so as you can see instead of
communicating with traditional design
materials I choose to communicate with
data often data gathered in a manual
analog laborious way as for a data
visualization I see it as a design
process that I used to work with this
material a processor as we move into the
future will be as common a method for a
designer to create and communicate with
as much as the golden mean color Theory
Design Systems and all of the other
tools and rules of thumb that designers
use daily and seeing data visualization
as a design process challenged me to
extend the visual languages that
designers used to work with data
exploring ways of presenting data that
besides being legible are more memorable
and more expressive to a lay person
audience who might just be learning
about data for the first time so this
could mean making data danceable like
this project I created as the first data
artists and residents at Facebook where
I converted a month of a couples
interactions on Facebook timelines into
dance steps bringing their digital dance
across time lines into a physical space
or it could mean making data hopital
like my open data playground for the
Southbank Centre in London where
hopscotch is were created from open data
sets in order to communicate
how open data is online for anyone to
play with and interpret however they
choose even if some of those
interpretations are less conventional
than others or it could mean making data
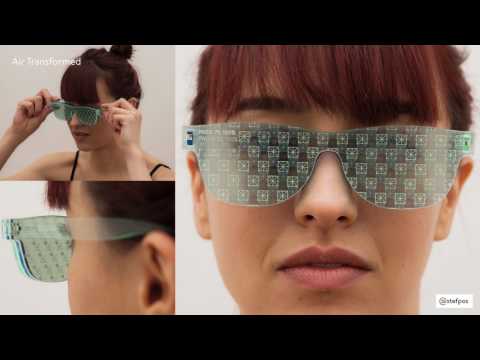
that’s touchable and wearable like this
Commission with Miriam quick where we
explored physical ways of communicating
air quality data from Sheffield in a
hopefully memorable way for a citizen
audience potentially uninterested in air
quality one part of the project
presented weeks of particulate matter
data as something you could touch and
wear and then the other part
communicated days of pollution levels in
Sheffield through glasses that would
make your vision more or less hazy
depending on the data okay as you can
see these projects aren’t your typical
bar chart and early in my career I give
talks about my work and people would ask
me what’s what’s the key insight
what’s the key truth revealed through
presenting this data as though they were
scientific visualizations or pieces of
data journalism and I couldn’t really
answer and this is when I realized I was
working with data in a different way
with a different process and a different
endpoint and since my work with data
didn’t always arrive at a grand
statistical conclusion it seemed that
for many people my work wasn’t valuable
or it wasn’t useful but I still felt
there was value in this analog laborious
often physical way of grappling with
data this process helped me stay in the
game and be closer to my work now as I
mentioned before I’m an American
immigrant turned British citizen over
time beginning to better understand the
nuances of British culture and at some
point I stumbled upon a slang term that
piqued my interest the slang term anorak
now one of my favorite words and after
research online I can define an anorak
as a person who is interested in the
collection of minuscule arcane and quite
often useless but
of information and the term comes from
the type of coat stereotypically worn by
trainspotters
as they gather their data on the train
platforms similar to the chat that you
see on screen and after looking at a
NanoRacks usual output lots of handmade
notations jottings and tallies like in
these notebooks from a train spotter and
a bird spotter on the left and then
looking at the output of my design
process on the right ok it was then that
I realised I too was a card-carrying
anorak due to how I found more value in
the data collection process and the end
statistical insight but as you can see
in this film the term anorak is
considered derogatory and negative in
the UK and baseball scorecards are often
considered one for the geeks it seemed
to be nerdy uncool and antisocial to be
collecting data on the things you’re
passionate about though I disagree data
collecting doesn’t have to offer
scientific conclusions to be meaningful
as the experience of data gathering can
be where the meaning is found and
experience is the right word data
gathering has been part of our human
experience for tens of thousands of
years early human writing systems
weren’t first used to record poetry
mythology or history but were used from
the beginning to record data to record
accounts and really we’re all secret
anoraks we’re all acting like data
Magpies collecting useless numbers and
storing them away as we move about our
day I mean many of us in this room will
know our precise weight watching every
creep of the number up and down the
scale or we might work we might mark
places we visited on a wall map at home
or know the precise calorie count of our
favourite biscuits really many of the
numbers we collect could be considered
as meaningless and as useless as the
data that an anorak collects but this
isn’t useless as the basic act of
collecting data on a topic any topic
means it’s important to the author and
brings the author closer to something
they care about looking at the data that
you gather as a secret anorak is a way
of figuring out what’s important to you
and you know we would never chastise a
new parent for their collection of the
often useless data it’s traditionally
gathered in a baby book or talked badly
of a family that carefully collected the
heights of its family members these
numbers are cherished and held on to you
through the years so as you can see many
people gather data to keep score to stay
in the game and to get closer to things
that matter to them and I see this
gathering of small data as valuable and
I consider another form of making where
someone might use this approach to make
sense to understand what they love more
closely or to make a connection to be
more present and aware or to make a
souvenir or memory to create a record of
the very human performance of just
living and of get-getting by where this
physical way of making through noting
and marking can offer the same
well-being in pleasure as other acts of
creation and for me I’ve chosen to use
this form of making as a critical part
of my design practice when we look at
data from this viewpoint we can see a
view of data quite different to the
often cold and computerized perception
of big data where data can now be seen
as warm and part of the human story and
data gathering is an act that can often
be joyful emotional memorable and
meaningful and this viewpoint what opens
up what’s possible using data now a data
sight can be presented with a focus on
its lateral truths revealing a collector
or visualizers emotions wants needs
personality and so on and artists can
respond to a data set in the same way
they can respond to an event an era or
something in the culture around us and
anoraks can gather data for the
experience and enjoyment of using this
process to get closer to
something they love and I’m excited
about how the same data set can now be a
scientific and analytical material and a
cultural artifact and the souvenir of an
experience eliciting completely
different responses in these different
spaces and all of these responses are
valid and valuable but really there’s a
similarity between these two camps with
data scientists on one side and the
anoraks and artists or designers on the
other while they both might work with
data in different ways they’re both
looking for truth and understanding
either of their subject or themselves
except for they’re using that truth to
different ends now these interact
tendencies of mine recently culminated
in a project that I undertook with
Georgia loopy an information designer
based in New York we realized we both
work with data using hand-drawn anorak
esque approaches and so we decided to
collaborate on a data and drawing
project together as we lived on
different continents we took this
constraint as our biggest asset and we
came up with a project we called ear
data a year sending each other
hand-drawn data postcards back and forth
across the Atlantic starting on the 1st
of September 2014 and lasting a year
every week we gathered data around a
shared topic in order to investigate
aspects of ourselves in our days to then
share with the other person and then at
the end of the week we’d spent time
analyzing that data and then we would
painstakingly draw our visualizations
and their annotations on a postcard and
once we were finished we would drop the
postcard in our mailbox or post box and
wait with our fingers crossed and if all
went well the postcard would arrive at
the other person’s address and we’d sit
down with the postcard and live the
other’s life through reading their week
compressed between two sides of paper so
a few examples from the year include a
week of capturing every time we said a
rude word or a
week of trying to capture our laughter
and almost impossible pursuits or we
gather data about our bad habits like a
week of our envy and we’d also survey
parts of our lives for the other like in
this week of our book collections we
mainly explore themes requiring manual
data collection we’re like in baseball
scoring the main pursuit was to use data
capture to make sense for ourselves and
be present and also to create a souvenir
to send to the other person halfway
through the year we made the project
public and the amazing response we
received made us realize that our anorak
approach resonated with a wider audience
where people would describe their data
using words that are normally not
associated with data and where data is
being described as something warm
instead of something cold and we also
received emails from people starting
dear data correspondence projects of
their own or who are using it as part of
their teaching materials for all ages
from primary school to university and
beyond to help students learn to collect
and present data we’ve been excited
about how our personal project became a
community project a community of anoraks
and this is something that we’re looking
to expand upon as mentioned dear data
originally started as a side project but
then it was published as a book both in
the US and in the UK and finally our
original postcards and our preliminary
sketch books were acquired by the Museum
of Modern Art in New York this
acquisition convinced us of the value of
our analog design approach and I believe
the project success is due to how it
speaks the latent anorak tendencies we
all have within us finally three dear
data being an anorak has hopefully moved
from something negative to something
positive as Paola Antonelli MoMA senior
design curator States when describing
the project she says
engaged conversation describes the
future of our relationship with
information and engage conversation is
the right phrase where Georgia and I
were able to better know each other and
ourselves through this analog engaged
act of keeping score of marking a year
and so I asked the audience to look
inward and acquaint yourself with your
secret anorak and remember that this
small imperfect data we all collect is a
way of continually engaging with
ourselves and the world around us and
shouldn’t be ignored but offers immense
value and how it helps us stay in the
game of our lives thank you [Applause]