
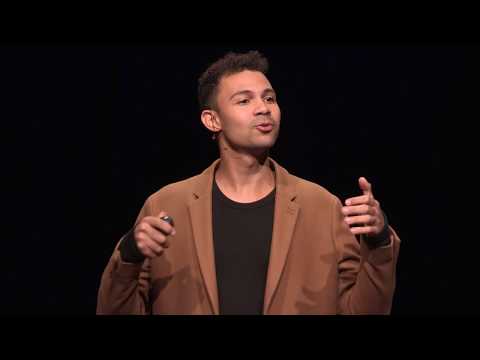
hello my name is Samuel Santiago a
co-founder of campaign zero and today
I’m going to tell a story about police
violence in America my story begins on
August 9th 2014 when Mike Brown jr. was
shot and killed in the streets of
Ferguson Missouri his death sparked a
wave of protests that has reverberated
around this country to this day there
are people still protesting in st. Louis
today and in those early days and weeks
and months of the protest movement there
was a national conversation that emerged
around police violence and its causes
its underlying conditions how it
impacted communities particularly
communities of color and all too often
those conversations were not grounded by
data and the reason for that is because
the federal government even to this day
does not collect comprehensive data on
the number of people killed by police in
this country they could tell you how
much rainfall there was in rural
Kentucky going back centuries but they
couldn’t tell you with any degree of
accuracy how many people police killed
in this country and so we built the most
comprehensive database of people killed
by police to answer the questions that
had emerged and that we’re continuing to
be asked all around this country we
looked at crowd-sourced data local media
reports obituaries criminal records
databases social media profiles public
records requests and analyzed and
synthesized and aggregated all of that
data into one database called mapping
police violence and then we figured out
how to visualize that data and tell a
data-driven story about what was
happening in this country and how we
could address this issue and it started
with this map this map shows nine
hundred and sixty-four people who are
killed by police this year in 2017 about
three to four people every single day
and I show this map because in those
early days so many people were not
convinced that this was a national
crisis that this in fact was nationwide
and scope they may have thought that
there was something going on in st.
Louis or there was something going on in
Baltimore but we use the data to show
in fact this was happening all over the
country in many different communities
and that it was impacting particular
communities to a larger degree so we
looked at the data by race and we found
that black people were three times more
likely to be killed by police than their
white peers that Latinos were about 1.5
times more likely Native Americans 1.5
times more likely than white people to
be killed by police per population we
also found that black and Latino people
were more likely to be unarmed when
killed by police we wanted to dive
deeper into this data so we could better
understand what was happening and start
to come up with solutions and so we
broke the data down by city and by state
and began to analyze at a much more
granular level what was happening and we
got this chart we looked at the hundred
largest cities in America and looked at
the rates of people killed by police per
capita and we found that there was a
huge level of variation there were
cities where police violence was
incredibly severe places like Orlando
Florida or Oklahoma City or st. Louis
Oklahoma City one in six homicides is
committed by police st. Louis a black
man in st. Louis is two times more
likely to be killed by police than the
average American is to be killed by
anyone civilian or police and then at
the other end of the spectrum there were
cities where police were not killing
people places like Buffalo New York
Plano Texas
Irvine California and we also wanted to
understand some more dynamics about what
was happening so for people who are
unarmed and killed by police what were
some of the racial dynamics there and so
you can see on the right side of this
map we looked at unarmed people killed
by police since 2013 and we coated it by
race and so you can see the red and the
orange are black and Latino people and
the gray are white people and what this
graph shows so clearly and so plainly is
that in major American cities almost
every unarmed person killed by police is
a person of color the majority of whom
are black this is a national crisis that
is particularly in severely impacting
communities of color and all too often
when a police officer shoots and kills
somebody they are not held accountable
by the criminal justice system so in 97%
of cases where an officer killed some
the officer is not charged with any
crime and in 99 percent of cases the
officer is not convicted of a crime it
even goes deeper than that so when an
officer is convicted of a crime they get
a lesser sentence than a civilian
convicted of the same crime in Georgia
an officer killed an unarmed black man
and what for the first time got a
sentence that allowed him to serve jail
time only on the weekends because he was
a police officer and it’s important as I
go over some of these numbers and
statistics to recognize that they are
not just numbers and statistics there
are lives there are people they are men
like Walter Scott women like Charlene
allows children like Tamir rice people
with families and communities that have
been torn apart by this violence so what
do we do with this data
now that we’ve collected it we’ve
collected an estimated 99% of the total
number of people killed by police in
this country since 2013 how can we use
it to actually enact change to lower the
resistance to that change and then to
put in place evidence-based solutions to
end police violence in this country and
it starts with debunking false
narratives that all too often make it
hard to push for change to happen in the
first place and one of those narratives
is around crime so whenever you hear a
conversation about police violence
particularly when you hear you know if
you’re watching Fox News or if you are
listening to police officials you will
hear an explanation that is grounded in
crime rates what they will say is that
police are killing people at the high
rates that I mentioned not because of
anything the police are doing wrong but
because they’re in dangerous situations
encountering dangerous violent people
and having to use deadly force to defend
themselves and others from harm that’s
the narrative you hear and it is an
assumption that is made there is no data
to support that narrative that is
presented in those conversations and so
we actually used the data that we
collected to interrogate that narrative
to see if it was the truth and what we
found was that actually there’s not a
connection between violent crime rates
in US cities and the rates of police
violence in those same cities there are
cities with high levels of violent crime
like Newark and Detroit that have
comparatively low levels of police
violence and there are cities with lower
levels of violent crime like Orlando
Florida that
much higher levels of police violence so
something else was explaining why police
violence it was happening in particular
places just to bring this point home
compare Buffalo New York with Orlando
Florida between 2013 and 2016 both of
those cities had similar populations
similar crime rates similar demographics
but police in Orlando Florida killed 15
people over that time period and Buffalo
New York zero people were killed by
police so what was happening in Buffalo
New York that was going right that we
can learn from that we can scale and
what was going wrong in Orlando Florida
that needed to change and that brought
us to a conversation about solutions so
we looked throughout our database over
5,000 records of people who have been
killed by police since 2013 we looked at
the initial reason for that incident
that occurred what was the reason that
police were responding to that case what
happened during those encounters what
were the policies and practices of those
police departments and what role did
they play in actually contributing to
that situation ending so violently and
that brought us to building a
comprehensive policy platform at the
local state and federal level called
campaign zero at endpoint solutions plan
to end police violence in this country
and it includes a number of things but
I’m going to go into a couple that are
really really important here the first
has to do with use of force policies of
a police department these are the
policies that a city and a Police
Department will set that authorized
police to use a particular level of
force in particular situations and what
we found was that these policies vary
dramatically across police departments
there’s no one uniform policy across
departments and so we looked at these
policies we did a public records request
for the hundred largest cities in the
country for their use of force policies
we got them back and we reviewed them in
concert with lawyers and you a former US
Department of Justice attorney and
activists across the country reviewing
each of these policies to see what were
the types of restrictions that they
placed on how and when police could use
force in particular situations and so
I’m going to use two examples here to
illustrate what that means
so contracts San Jose Police
Department’s use of force policy in
California with Philadelphia Police
Department so
San Jose Police Department use of force
policy I’m just gonna read at the policy
word-for-word officers need not retreat
or desist in the reasonable use of force
there is no requirement that officers
use a lesser intrusive force option
before progressing to a more intrusive
one that’s the standard those offices
are held accountable to compare that to
Philadelphia retreating or repositioning
is not a sign of weakness or cowardice
by an officer it is often the tactically
superior police procedure rather than
the immediate use of force the use of
deadly force is an extreme measure to
only be employed in the most extreme
situations after all lesser means of
force have been exhausted so San Jose
Police Department policy officers need
not retreat or desist and there’s no
requirement to use a lesser intrusive
means of force before progressing to a
more severe one Philadelphia takes exact
opposite they have to use the least
intrusive measured measure of force and
retreating repositioning de-escalated
are actually prioritized as a standard
for those police officers so what does
that mean do those policies actually
matter right does that actually impact
those rates of police violence that I
showed so we investigated that further
we looked at for the hundred largest
police departments in the country what
those policies were and we mapped them
out in a grid for eight different types
of use of force policies things like
requiring de-escalation specifying the
types of force that can be used in
particular situations banning things
like chokeholds and strangleholds
requiring officers to exhaust all other
reasonable means like Philadelphia does
before progressing to deadly force
requiring officers to intervene if they
see another officer using excessive
force restricting police shooting at
moving vehicles which we know often
results in a more dangerous situation
because if you disable that driver the
vehicle then becomes a missile and
requiring officers to report and those
reports to be investigated whenever a
use of force is used so we’ve matched
that against the rates of police
killings of those departments and found
that each of those eight policies was
associated in a lower rate of police
use of deadly force so much so that
police departments that required
officers to exhaust all other reasonable
means we’re 25% less likely to kill
civilians in their jurisdiction if they
required the escalation 15% less likely
to kill civilians under their
jurisdiction and when you combine these
policies the effects really are dramatic
a police department that adopts all
eight of these policies when controlling
for other factors like arrests and
threats on officers and the demographics
of a department and the level of
inequality in the department controlling
for all of those factors departments
that enact all eight of these policies
were 72 percent less likely to kill
civilians than departments that enacted
none of them so there are solutions here
evidence-based data-driven solutions for
how we can address this issue in our
communities and what’s interesting about
them is the departments that enact these
solutions are actually safer for
officers too so when you when you try to
move these policies in cities what you
will often hear from police unions and
people who are opposing them is that
these types of measures endanger
officers because they prevent officers
from using all the tools and discretion
at their disposal to defend themselves
but when you look at the data it’s
actually safest for officers in these
jurisdictions so we can enact these it’s
a win-win for officers and for civilians
and so building on this platform we have
been advocating for change at every
level of government for local police
departments to enact these policies
within their Administrative Code for
cities to pass ordinances that support
these policies for states to move them
into state law and enact them for the
federal government to use its funding
streams to incentivize these types of
solutions we’ve been tracking
legislation in every state and what we
found is that there’s actually been some
progress 30 states have enacted a law
that establishes at least one of these
measures to address police violence that
we’ve proposed through campaign zero
what’s more the federal government under
the previous administration took access
took action to limit militarization and
to collect better data on this issue
their database is going to adopt the
same methodology that I articulated
earlier so that they can actually for
the first time come up with a
comprehensive federal accounting for
people killed by police in this country
but it’s only the beginning in order to
excel
that change it’s gonna take all of us to
be involved in this work change is an
easy policy change in particular as
we’ve seen in Congress is hard it takes
thousands and hundreds of thousands of
people to make an impact here and so
we’ve developed new tools and technology
to make that process easier for example
this widget that we developed which
allows you to put in your zip code it
shows you who your state and federal
representatives are what votes they’ve
taken on police reform measures and
allows you to contact them and urge them
to take action all in three clicks or
less we’ve had almost a hundred thousand
people use this tool to contact their
representatives but again it’s only the
beginning we recruited 33,000 people
volunteers from across the country in
two weeks who wanted to get involved but
it’s still a fraction of those who could
get involved in this work because there
are a hundred and four million Americans
according to Pew Research surveys who
support the black lives matter movement
the majority of people in this country
believe in justice and equity when you
pull them and that’s new that is
actually change and result and as a
result of this protest movement where it
used to be a small proportion of the
population about 39 to 40 percent of the
country believe that more chances were
needed in order to secure equal rights
in this country for people of color now
it’s about sixty percent in only the
space of a couple of years so the
question is how do we mobilize over a
hundred million people in this work what
types of tools and technologies can we
build to onboard people at scale in the
process of advocating for change at
every level of government what if we
engaged everyone in the work it should
be as easy as taking out your phone
saying I’m in Brookings I’m a lawyer I
have three hours a week and it connects
you immediately to a task that you can
do right away that is the most
strategically aligned to making impact
in that area connects you to an
organization that can support you in
network into learnings that you can use
to teach others about this issue that’s
the type of work that we’re doing –
that’s the type of tool and technology
that we want to build and so I invite
you to join us in this effort to achieve
a world and a vision in which black
lives matter and which we’ve ended
police violence once and for all
so thank you
you
[Applause]
co-founder of campaign zero and today
I’m going to tell a story about police
violence in America my story begins on
August 9th 2014 when Mike Brown jr. was
shot and killed in the streets of
Ferguson Missouri his death sparked a
wave of protests that has reverberated
around this country to this day there
are people still protesting in st. Louis
today and in those early days and weeks
and months of the protest movement there
was a national conversation that emerged
around police violence and its causes
its underlying conditions how it
impacted communities particularly
communities of color and all too often
those conversations were not grounded by
data and the reason for that is because
the federal government even to this day
does not collect comprehensive data on
the number of people killed by police in
this country they could tell you how
much rainfall there was in rural
Kentucky going back centuries but they
couldn’t tell you with any degree of
accuracy how many people police killed
in this country and so we built the most
comprehensive database of people killed
by police to answer the questions that
had emerged and that we’re continuing to
be asked all around this country we
looked at crowd-sourced data local media
reports obituaries criminal records
databases social media profiles public
records requests and analyzed and
synthesized and aggregated all of that
data into one database called mapping
police violence and then we figured out
how to visualize that data and tell a
data-driven story about what was
happening in this country and how we
could address this issue and it started
with this map this map shows nine
hundred and sixty-four people who are
killed by police this year in 2017 about
three to four people every single day
and I show this map because in those
early days so many people were not
convinced that this was a national
crisis that this in fact was nationwide
and scope they may have thought that
there was something going on in st.
Louis or there was something going on in
Baltimore but we use the data to show
in fact this was happening all over the
country in many different communities
and that it was impacting particular
communities to a larger degree so we
looked at the data by race and we found
that black people were three times more
likely to be killed by police than their
white peers that Latinos were about 1.5
times more likely Native Americans 1.5
times more likely than white people to
be killed by police per population we
also found that black and Latino people
were more likely to be unarmed when
killed by police we wanted to dive
deeper into this data so we could better
understand what was happening and start
to come up with solutions and so we
broke the data down by city and by state
and began to analyze at a much more
granular level what was happening and we
got this chart we looked at the hundred
largest cities in America and looked at
the rates of people killed by police per
capita and we found that there was a
huge level of variation there were
cities where police violence was
incredibly severe places like Orlando
Florida or Oklahoma City or st. Louis
Oklahoma City one in six homicides is
committed by police st. Louis a black
man in st. Louis is two times more
likely to be killed by police than the
average American is to be killed by
anyone civilian or police and then at
the other end of the spectrum there were
cities where police were not killing
people places like Buffalo New York
Plano Texas
Irvine California and we also wanted to
understand some more dynamics about what
was happening so for people who are
unarmed and killed by police what were
some of the racial dynamics there and so
you can see on the right side of this
map we looked at unarmed people killed
by police since 2013 and we coated it by
race and so you can see the red and the
orange are black and Latino people and
the gray are white people and what this
graph shows so clearly and so plainly is
that in major American cities almost
every unarmed person killed by police is
a person of color the majority of whom
are black this is a national crisis that
is particularly in severely impacting
communities of color and all too often
when a police officer shoots and kills
somebody they are not held accountable
by the criminal justice system so in 97%
of cases where an officer killed some
the officer is not charged with any
crime and in 99 percent of cases the
officer is not convicted of a crime it
even goes deeper than that so when an
officer is convicted of a crime they get
a lesser sentence than a civilian
convicted of the same crime in Georgia
an officer killed an unarmed black man
and what for the first time got a
sentence that allowed him to serve jail
time only on the weekends because he was
a police officer and it’s important as I
go over some of these numbers and
statistics to recognize that they are
not just numbers and statistics there
are lives there are people they are men
like Walter Scott women like Charlene
allows children like Tamir rice people
with families and communities that have
been torn apart by this violence so what
do we do with this data
now that we’ve collected it we’ve
collected an estimated 99% of the total
number of people killed by police in
this country since 2013 how can we use
it to actually enact change to lower the
resistance to that change and then to
put in place evidence-based solutions to
end police violence in this country and
it starts with debunking false
narratives that all too often make it
hard to push for change to happen in the
first place and one of those narratives
is around crime so whenever you hear a
conversation about police violence
particularly when you hear you know if
you’re watching Fox News or if you are
listening to police officials you will
hear an explanation that is grounded in
crime rates what they will say is that
police are killing people at the high
rates that I mentioned not because of
anything the police are doing wrong but
because they’re in dangerous situations
encountering dangerous violent people
and having to use deadly force to defend
themselves and others from harm that’s
the narrative you hear and it is an
assumption that is made there is no data
to support that narrative that is
presented in those conversations and so
we actually used the data that we
collected to interrogate that narrative
to see if it was the truth and what we
found was that actually there’s not a
connection between violent crime rates
in US cities and the rates of police
violence in those same cities there are
cities with high levels of violent crime
like Newark and Detroit that have
comparatively low levels of police
violence and there are cities with lower
levels of violent crime like Orlando
Florida that
much higher levels of police violence so
something else was explaining why police
violence it was happening in particular
places just to bring this point home
compare Buffalo New York with Orlando
Florida between 2013 and 2016 both of
those cities had similar populations
similar crime rates similar demographics
but police in Orlando Florida killed 15
people over that time period and Buffalo
New York zero people were killed by
police so what was happening in Buffalo
New York that was going right that we
can learn from that we can scale and
what was going wrong in Orlando Florida
that needed to change and that brought
us to a conversation about solutions so
we looked throughout our database over
5,000 records of people who have been
killed by police since 2013 we looked at
the initial reason for that incident
that occurred what was the reason that
police were responding to that case what
happened during those encounters what
were the policies and practices of those
police departments and what role did
they play in actually contributing to
that situation ending so violently and
that brought us to building a
comprehensive policy platform at the
local state and federal level called
campaign zero at endpoint solutions plan
to end police violence in this country
and it includes a number of things but
I’m going to go into a couple that are
really really important here the first
has to do with use of force policies of
a police department these are the
policies that a city and a Police
Department will set that authorized
police to use a particular level of
force in particular situations and what
we found was that these policies vary
dramatically across police departments
there’s no one uniform policy across
departments and so we looked at these
policies we did a public records request
for the hundred largest cities in the
country for their use of force policies
we got them back and we reviewed them in
concert with lawyers and you a former US
Department of Justice attorney and
activists across the country reviewing
each of these policies to see what were
the types of restrictions that they
placed on how and when police could use
force in particular situations and so
I’m going to use two examples here to
illustrate what that means
so contracts San Jose Police
Department’s use of force policy in
California with Philadelphia Police
Department so
San Jose Police Department use of force
policy I’m just gonna read at the policy
word-for-word officers need not retreat
or desist in the reasonable use of force
there is no requirement that officers
use a lesser intrusive force option
before progressing to a more intrusive
one that’s the standard those offices
are held accountable to compare that to
Philadelphia retreating or repositioning
is not a sign of weakness or cowardice
by an officer it is often the tactically
superior police procedure rather than
the immediate use of force the use of
deadly force is an extreme measure to
only be employed in the most extreme
situations after all lesser means of
force have been exhausted so San Jose
Police Department policy officers need
not retreat or desist and there’s no
requirement to use a lesser intrusive
means of force before progressing to a
more severe one Philadelphia takes exact
opposite they have to use the least
intrusive measured measure of force and
retreating repositioning de-escalated
are actually prioritized as a standard
for those police officers so what does
that mean do those policies actually
matter right does that actually impact
those rates of police violence that I
showed so we investigated that further
we looked at for the hundred largest
police departments in the country what
those policies were and we mapped them
out in a grid for eight different types
of use of force policies things like
requiring de-escalation specifying the
types of force that can be used in
particular situations banning things
like chokeholds and strangleholds
requiring officers to exhaust all other
reasonable means like Philadelphia does
before progressing to deadly force
requiring officers to intervene if they
see another officer using excessive
force restricting police shooting at
moving vehicles which we know often
results in a more dangerous situation
because if you disable that driver the
vehicle then becomes a missile and
requiring officers to report and those
reports to be investigated whenever a
use of force is used so we’ve matched
that against the rates of police
killings of those departments and found
that each of those eight policies was
associated in a lower rate of police
use of deadly force so much so that
police departments that required
officers to exhaust all other reasonable
means we’re 25% less likely to kill
civilians in their jurisdiction if they
required the escalation 15% less likely
to kill civilians under their
jurisdiction and when you combine these
policies the effects really are dramatic
a police department that adopts all
eight of these policies when controlling
for other factors like arrests and
threats on officers and the demographics
of a department and the level of
inequality in the department controlling
for all of those factors departments
that enact all eight of these policies
were 72 percent less likely to kill
civilians than departments that enacted
none of them so there are solutions here
evidence-based data-driven solutions for
how we can address this issue in our
communities and what’s interesting about
them is the departments that enact these
solutions are actually safer for
officers too so when you when you try to
move these policies in cities what you
will often hear from police unions and
people who are opposing them is that
these types of measures endanger
officers because they prevent officers
from using all the tools and discretion
at their disposal to defend themselves
but when you look at the data it’s
actually safest for officers in these
jurisdictions so we can enact these it’s
a win-win for officers and for civilians
and so building on this platform we have
been advocating for change at every
level of government for local police
departments to enact these policies
within their Administrative Code for
cities to pass ordinances that support
these policies for states to move them
into state law and enact them for the
federal government to use its funding
streams to incentivize these types of
solutions we’ve been tracking
legislation in every state and what we
found is that there’s actually been some
progress 30 states have enacted a law
that establishes at least one of these
measures to address police violence that
we’ve proposed through campaign zero
what’s more the federal government under
the previous administration took access
took action to limit militarization and
to collect better data on this issue
their database is going to adopt the
same methodology that I articulated
earlier so that they can actually for
the first time come up with a
comprehensive federal accounting for
people killed by police in this country
but it’s only the beginning in order to
excel
that change it’s gonna take all of us to
be involved in this work change is an
easy policy change in particular as
we’ve seen in Congress is hard it takes
thousands and hundreds of thousands of
people to make an impact here and so
we’ve developed new tools and technology
to make that process easier for example
this widget that we developed which
allows you to put in your zip code it
shows you who your state and federal
representatives are what votes they’ve
taken on police reform measures and
allows you to contact them and urge them
to take action all in three clicks or
less we’ve had almost a hundred thousand
people use this tool to contact their
representatives but again it’s only the
beginning we recruited 33,000 people
volunteers from across the country in
two weeks who wanted to get involved but
it’s still a fraction of those who could
get involved in this work because there
are a hundred and four million Americans
according to Pew Research surveys who
support the black lives matter movement
the majority of people in this country
believe in justice and equity when you
pull them and that’s new that is
actually change and result and as a
result of this protest movement where it
used to be a small proportion of the
population about 39 to 40 percent of the
country believe that more chances were
needed in order to secure equal rights
in this country for people of color now
it’s about sixty percent in only the
space of a couple of years so the
question is how do we mobilize over a
hundred million people in this work what
types of tools and technologies can we
build to onboard people at scale in the
process of advocating for change at
every level of government what if we
engaged everyone in the work it should
be as easy as taking out your phone
saying I’m in Brookings I’m a lawyer I
have three hours a week and it connects
you immediately to a task that you can
do right away that is the most
strategically aligned to making impact
in that area connects you to an
organization that can support you in
network into learnings that you can use
to teach others about this issue that’s
the type of work that we’re doing –
that’s the type of tool and technology
that we want to build and so I invite
you to join us in this effort to achieve
a world and a vision in which black
lives matter and which we’ve ended
police violence once and for all
so thank you
you
[Applause]
Please follow and like us: